
By Benjamin Minch, Staff Writer
In a world where data can be found in just about every blog post, news article or online rant, it is insanely hard to distinguish true from false. Each writer has their own bias and seems to present counterproductive data in comparison with others. By far the most manipulated data of all is climate change data. This manipulation is two sided and takes place because it is such a hot worldwide debate with the potential to cause immense damage.
Here is a standard example of some raw climate change data that is observing the total mass of the ice sheets in greenland over the course of many years.
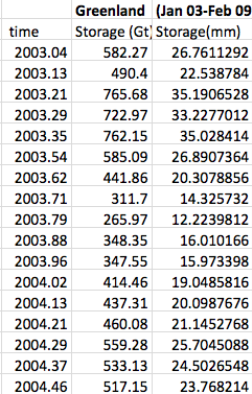
With this raw data, you can make a graph that looks something like this.
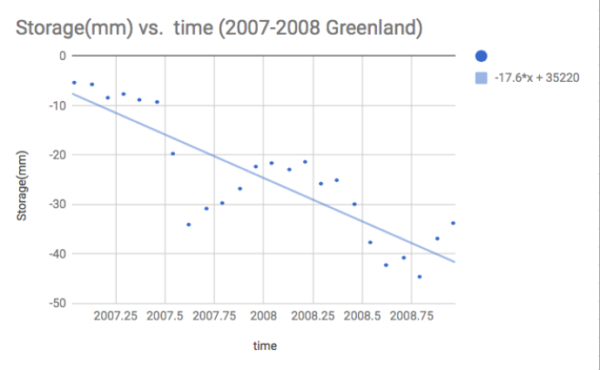
Or… you could make a graph that looks something like this.
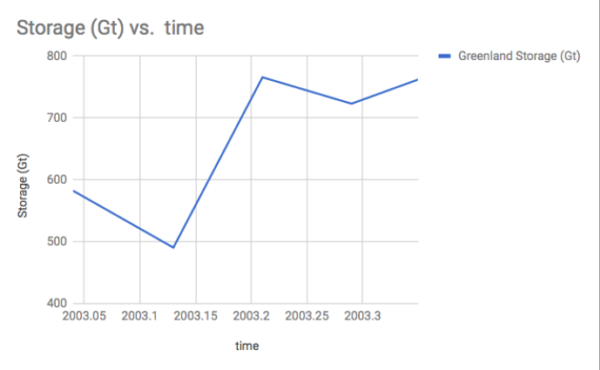
At surface level, these graphs both seem like they are representing the same thing, which is one of the strategies that professionals employ to manipulate the data. It may seem as these are both comparing storage of water as ice in Greenland’s ice sheets, but there are a few drastic differences. In graph one, the time period spans over a year and points are taken when ice is declining. In the second graph, the data only represents the span of a few months, during which ice usually increases because of the seasonal change.
At first glance when graph two ends up in an article, it may make a strong point that climate change is fake because the data says otherwise. Although it seems silly, this kind of manipulation is happening daily, in just about any scientific article you read that isn’t in an academic journal. Scientists are obsessed with defending their point and also happen to be good at manipulating data.
Have you noticed that in the last few years the phrase “global warming” has seemingly changed into the phrase “climate change”? This is another tactic that is used because it is a lot easier to make someone believe that the climate is changing than it is to make them believe that the world is warming to dangerous levels.
Lets take a look at what a manipulated graph looks like that was published on a major science news website: National Geographic.
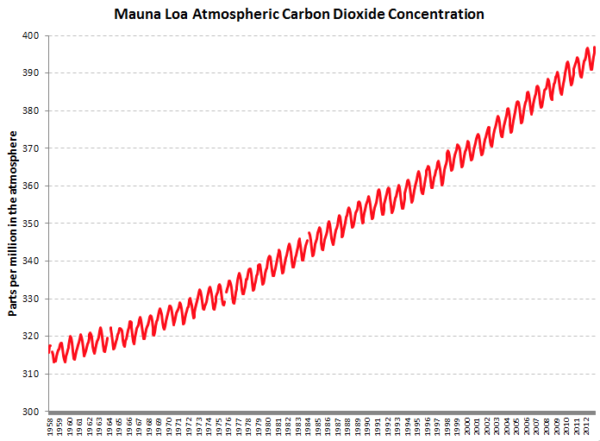
At first glance, this graph seems to show a huge increase in CO2 emissions in Mauna Loa. The graph has a very steep slope and it is strategically colored red to show an urgent problem. The data also seems legit because of the wide range of dates uses from 1958-2012. That is 54 years meaning it must be reputable, right? One thing that you might have missed from this graph is the extremely small y axis range. This graph only goes from 300 ppm to 400 ppm, which is only a 1/10,000 difference. Although the difference between 1958 and 2012 may seem significant, the data has actually just been manipulated with a small range, so the validity is questionable.
This is the same tactic employed by thousands of science writers daily and in order to remain an informed member of society, you must be able to spot it and evaluate it. Hopefully this article helps you to be watchful and logical people when approaching data and manipulation on the internet.